Multi Channel
All your data on a single digital dashboard

One Dashboard to rule them all
All your data on a single digital dashboard
Saving time and simplicity,our analysts create your digital dashboard according to your needs
An unique technology that crosses millions of web data with your own data
We’ve been looking for a marketing dashboard for a long time to analyze our key performance indicators in a clear, tailored platform. The different tabs of the dashboard gives us for example access to the eve of our brand on different media in a distinct way, such as social networks, blogs, forums. A great way to follow and react to our ereputation.
We also have access to SEO data such as the keywords on which we are visible and those on which we need to make progress. There is also data on the user experience of our visitors, the speed of our server, our paid campaign data, our conversions, our brand ambassadors,…. the possibilities are almost limitless.
It is an all-in-one digital marketing platform that caters to several services of our company: marketing, management, communication,.. The “editorial watch” part is particularly appreciated by our editorial department because it allows them to identify the topics sought by our audience and thus to write targeted articles.
Ifocop
Our customers love Digital Dashboard because it allows them to focus on the data they need centrally. This is for people who can’t take it anymore from generic dashboards, not adapted to their needs, too complicated, scattered over several websites, and who can’t easily find data they’re looking for. Your KPI summarized and available quickly in one place.

All your centralized marketing data in a single interface
Monitoring data (ereputation, editorial, competetion) in real time
Your dashboard available everywhere: fits all screens, even TVs.
The different marketing channels are materialized by dedicated tabs
Your custom indicators according to your marketing strategy
Our team creates your dashboard to save you time and resources. It is first configured and then delivered with predefined elements for each channel. Our experience has allowed us to build a standard interface with the data most often requested by our customers.
On top of that, everything is customizable, we take care of everything. Your Digital Dashboard can search for hundreds of data sources and add new features to your request. It’s a unique, custom and scalable solution.
All data is presented to be usable, each widget has a “tip” section explaining how to use each information operationally.
Your teams have nothing to configure, they can focus on the essentials and seize the opportunities offered like improving well-positioned pages on Google but with a bad CTR, correct incoming links in error 404, … The platform is developed to achieve results.
The dashboard includes, among other things, strategic intelligence tools to control what is said about your brand (ereputation), respond to those who mention you, identify current topics, contact future ambassadors of your brand,…
With a clear knowledge of your customers or your audience: Who are they? What are they looking for? Where are they? You will be able to improve your lead base and future customers.
Our platform brings together analytics tools to measure the success of your marketing campaigns: Social media campaigns, SEO campaigns, SEA (adwords) campaigns, emailing campaigns, etc.
A cross-sectional and centralized view of your marketing strategy across your various communication channels will allow you to know your conversion rates and ensure a better return on investment (ROI)
Here are some non-exhaustive examples of the possibilities of Digital Dashboard
Click on the different tabs to see all the digital dashboards

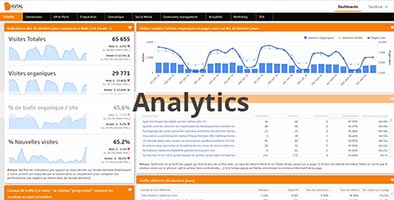
Custom reports from your Google analytics data or other traffic tracking tools. Follow the analytics indicators you need. Easily compare the kpi of your website last month and last year: channel traffic, traffic by media, page views, time spent, …
Depending on your needs, you can be helped to implement new tracking analytics elements (e.g., conversion goals, custom dimensions, etc.).

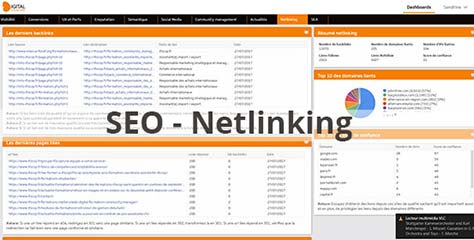
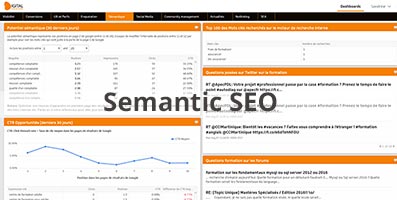
Different widgets allow you to measure the effectiveness of your work in natural referencing. What keywords is the site positioned on? What are the keywords close to Google page 1 that can be improved (semantic potential). Which pages are well positioned but with a bad clickthr through (CTR)? What keywords are searched on your internal search engine? And other information regarding netlinking, errors 404, …
The analysis of real-time logs will allow you to know the pages crawled by Googlebot, those that are not, the age of the pages visited, to identify the useless pages that waste the crawl, etc.

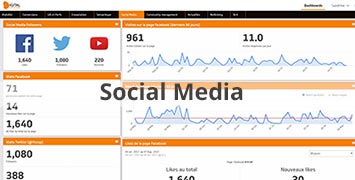
Various social media widgets allow you to easily measure the performance of your campaigns on social networks.
The social media dashboard gives you a summary of your community engagement: reach, likes, favorites, number of views (youtube), subscriber progression and other data for each social network.

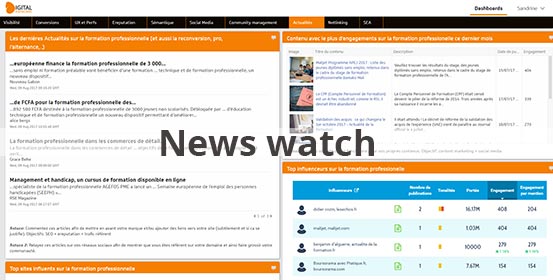
The Content Monitoring dashboard, which can also be described as media monitoring, allows you to monitor information on a subject, an industry, people, etc. Our standby technology eliminates noise and filters information below a certain level of engagement.
The aim is to inspire you on the trendy content to feed your blog, to participate by commenting, to create backlinks, to relay this information on your social networks, … The objectives are multiple: show your audience that you are an authority on your field of activity, improve your SEO, ..

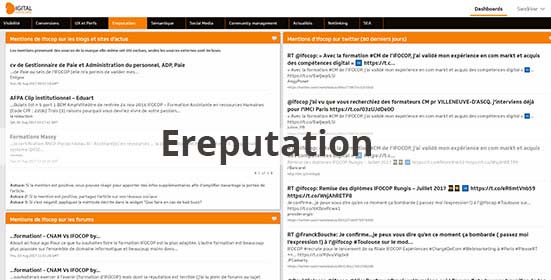
A company’s online reputation is a major issue for your brand image and conversion rate. Real-time monitoring of brand mentions allows you to react quickly in case of bad buzz or to identify ambassadors of your brand.
Our e-reputation dashboard tracks brand mentions on search engines, social media, forums, blogs, media websites, …

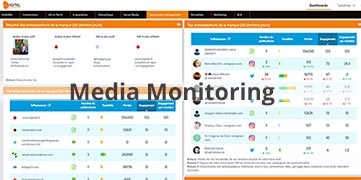
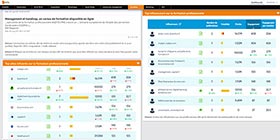
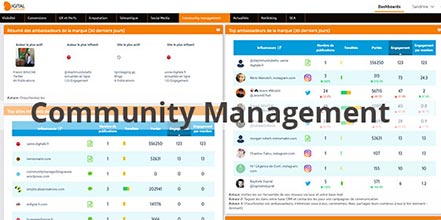
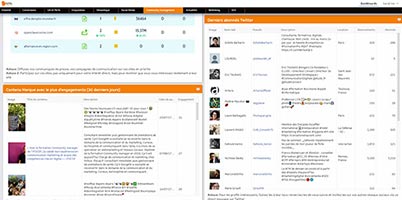
Our webmarketing dashboard allows you to follow the influencers on your industry in order to approach them and turn them into brand ambassadors. This dashboard dedicated specifically to community managers allows you to monitor your most shared content on social networks.
This content can be blog posts, news or any post on social networks (facebook, twitter, instagram, linkedin, etc.). All of this web content is categorized by level of engagement (shares, comments, likes,..) to allow you to focus on the essentials.

Our digital dashboard can connect to your emailing software to extract data that the software interface is not able to display.
In addition to simplifying data reading and centralizing everything in one place. What is also the strength of our solution is the possibility of data crossovers with other tools like Google analytics for example or your CRM.

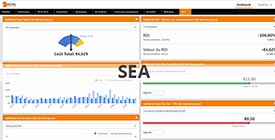
Our SEA/SEM dashboard tracks the performance of your ad campaigns on Google adwords, faeboods ads or other online ads.
Return on investment, cost per acquisition, cost per click, cost per conversion, keyword performance, cost evolution, comparison with previous periods, etc. Data is complicated or impossible to extract otherwise, and you can finally visualize in a simple way.

Salesforce / hubspot / Pipedrive and other CRM with an open API allow for example cross-data between leads and conversions. Visualize your conversion tunnel has never been easier: visitors, leads, opportunities, conversions.
Compare conversions between new and recurring visitors. Track your sales statistics against the month or year before. Comparative view between brand mentions and successful conversions. Follow conversions by lead type, by lenses, by channel, by support.

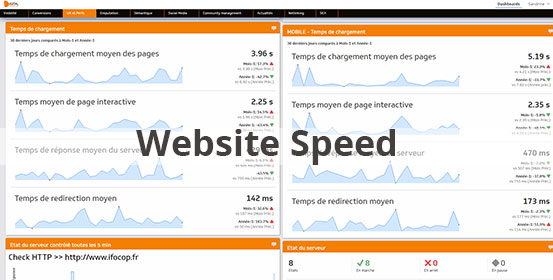
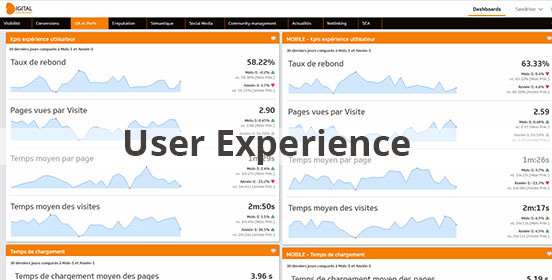
The user experience is an essential element for the success of any digital project. Our platform allows you to track the level of engagement of your users on your website: Time spent per page, bounce rate, page views per visit, average time spent per page, user loading time….
You can view this information by type of medium (computer, mobile), by type of pages, by type of visitors (new visitors, recurring visitors), etc.